Project
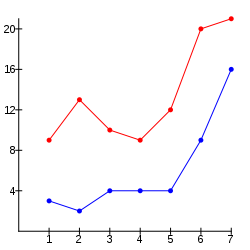
Up to this point, for the most part, I’ve thrown a lot of small examples at you to show how specific constructs work. Now it’s time to do a larger program and put some of these things together. The larger program, in this case, will be the program that used this list of mnimum and maximum temperatures:
[[3 9] [2 13] [4 10] [4 9] [4 12] [9 20] [16 21]]
to draw the graph you saw in the preface:
Planning
What will you need to know to draw the graph? Among other things:
- How to draw graphs in real life.
- How to represent the data to be graphed.
- The functions you want to write to do the task.
- How to draw on a web page; this will require knowing how to use the JavaScript functions that work with the HTML
<canvas>element.
Drawing a Graph
Here’s an incredibly brief review of how graphs work in a Cartesian coordinate system, where points are described by x (horizontal) and y (vertical) coordinates. In the classic Cartesian system, the origin—point (0, 0) is where the x and y axes meet.
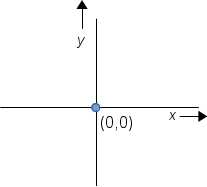
There is no law that says that the origin must be in the dead center of the graph, and, in fact, in the temperature graph, you see that it is near the lower left.
Representing the Data
When I wrote the original program, it was “custom built” to draw the graph directly from the original vector of vectors. While writing this section of the book, I decided to make the code a bit more general. My design changed from the original design, but that’s OK. Sometimes you write a program, see how it works, realize you could do it better, and do a rewrite. In this case, rather than simply separate the data into a minimum and maximum vector, I thought it would be better to split the data into vectors that contain both an x and y coordinate, with the x coordinate being a day of the week from 1 to 7. Thus, the original data would split into these two vectors:
[[[1 3] [2 2] [3 4] [4 4] [5 4] [6 9] [7 16]]
 [[1 9] [2 13] [3 10] [4 9] [5 12] [6 20] [7 21]]]
Back in the chapter on the reduce function, you developed code to do a simple split into a minimum and maximum vector. While you could use reduce to create these vectors with the numbering as the first entry in each pair, you can also use the map-indexed function. It works like map, except that the function you provide has two parameters: the “index number” and the item from the collection being mapped. Here is an example that takes a list of words and returns a vector of upper-cased words and their position in the list (starting at zero):
Now, see if you can do the split of the temperatures. Hint: use map-indexed twice. The first time, extract the first item in the temperature pair (the low temperature). The second time, extract the second item in the temperature pair. Remember that the index stars at zero, so you will want to add one; you can use the inc function for that.
In addition to splitting up the data, the program needs functions to:
- Draw the axes
- Draw tick marks on the axes
- Draw labels near the axes
- Draw a point.
- Draw a line connecting a series of points.
- Draw a dot at each of the points.
All this talk of drawing—so how do you draw from ClojureScript? You use the API (application program interface) for the <canvas> element.