Graphing Program: Outline
As a reminder, the object is to transform this data:
[[3 9] [2 13] [4 10] [4 9] [4 12] [9 20] [16 21]]
into this graph:
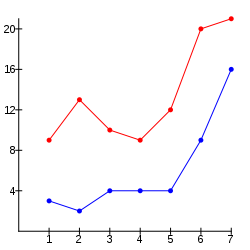
The program will have to:
Split the temperatures into two sets of x, y pairs to be graphed:
[[[1 3] [2 2] [3 4] [4 4] [5 4] [6 9] [7 16]]
[[1 9] [2 13] [3 10] [4 9] [5 12] [6 20] [7 21]]]
Draw the axes:
- Draw the lines
- Draw the tick marks
- Draw the labels
Draw a connected line for the minimum teperatures
Draw dots for the minimum temperatures
Draw a connected line for the maximum temperatures
Draw dots for the maximum temperatures